Asset Management / Performance
What the book actually returned.
Return on the whole portfolio and on every line in it, over any window, with realised and unrealised split apart and the contribution of each position shown against the total. The number, and the rows that produced it.


Every window, not just this one
A book up on the day can be flat on the quarter and down on the year, and whoever quoted it picked the window that made their point. Day, month, quarter, year and since inception sit on one row, so the comparison is the whole ladder rather than the column somebody chose.
- Day through inception
Every window on one row
- Any date range
Including the ones nobody quotes
- Per line and in total
The same windows at both levels
Realised apart from unrealised
A gain you have taken and a gain you are still carrying are different facts about the book, and a single return figure hides which one you are looking at. They are split here, with the cost basis behind each so the number can be checked rather than trusted.
- Split at every level
Per line, per venue, and for the book
- Cost basis attached
The arithmetic is on the page
- Fees and funding counted
What the position actually cost to hold
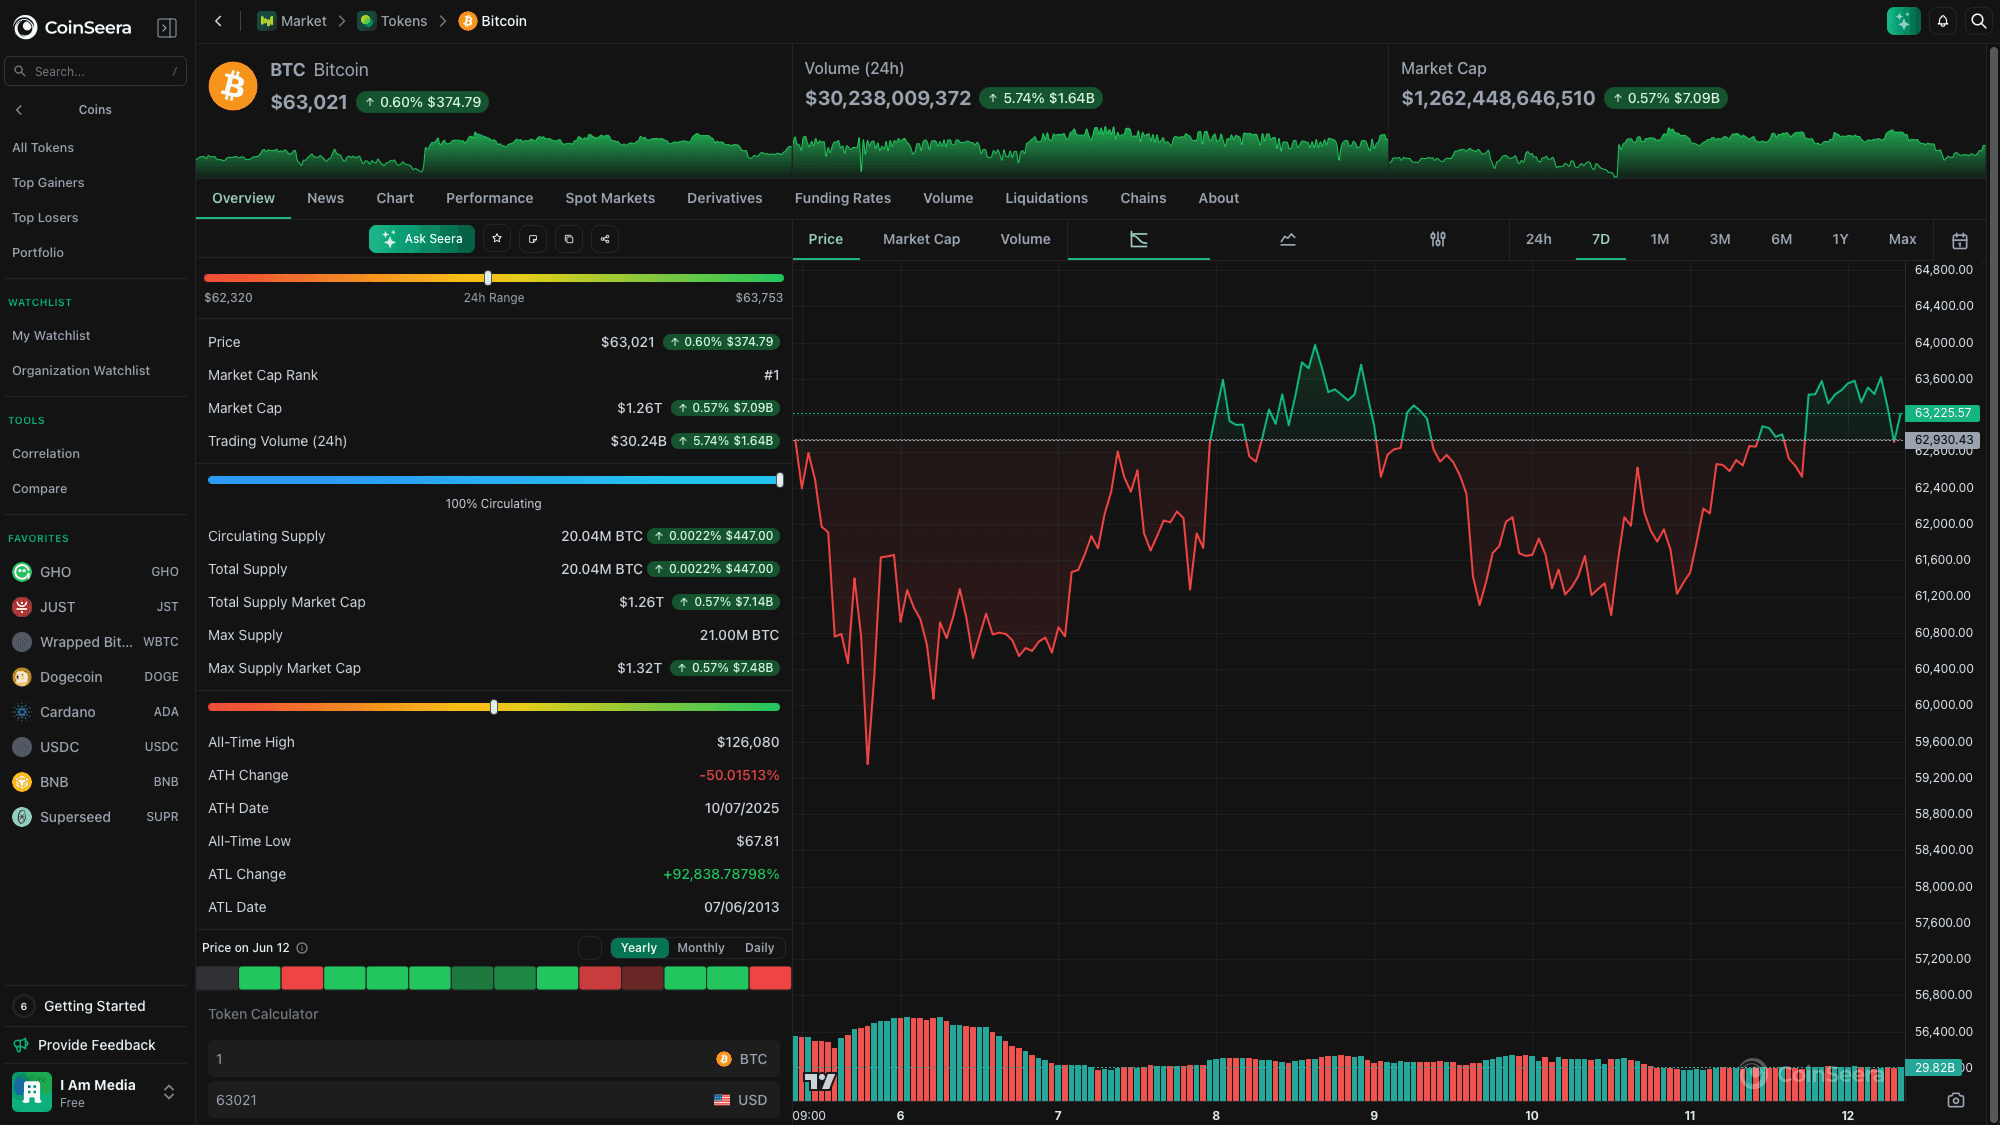
Which line carried it
A book up 4% is usually up on two of its forty lines. Contribution ranks every position by what it added or took away, so the number resolves into names rather than staying an aggregate nobody can act on.
- Ranked by contribution
What each line added to the total
- Losers at the same weight
Drawdown is not hidden below the fold
- Against a benchmark
The return, and what it was measured against
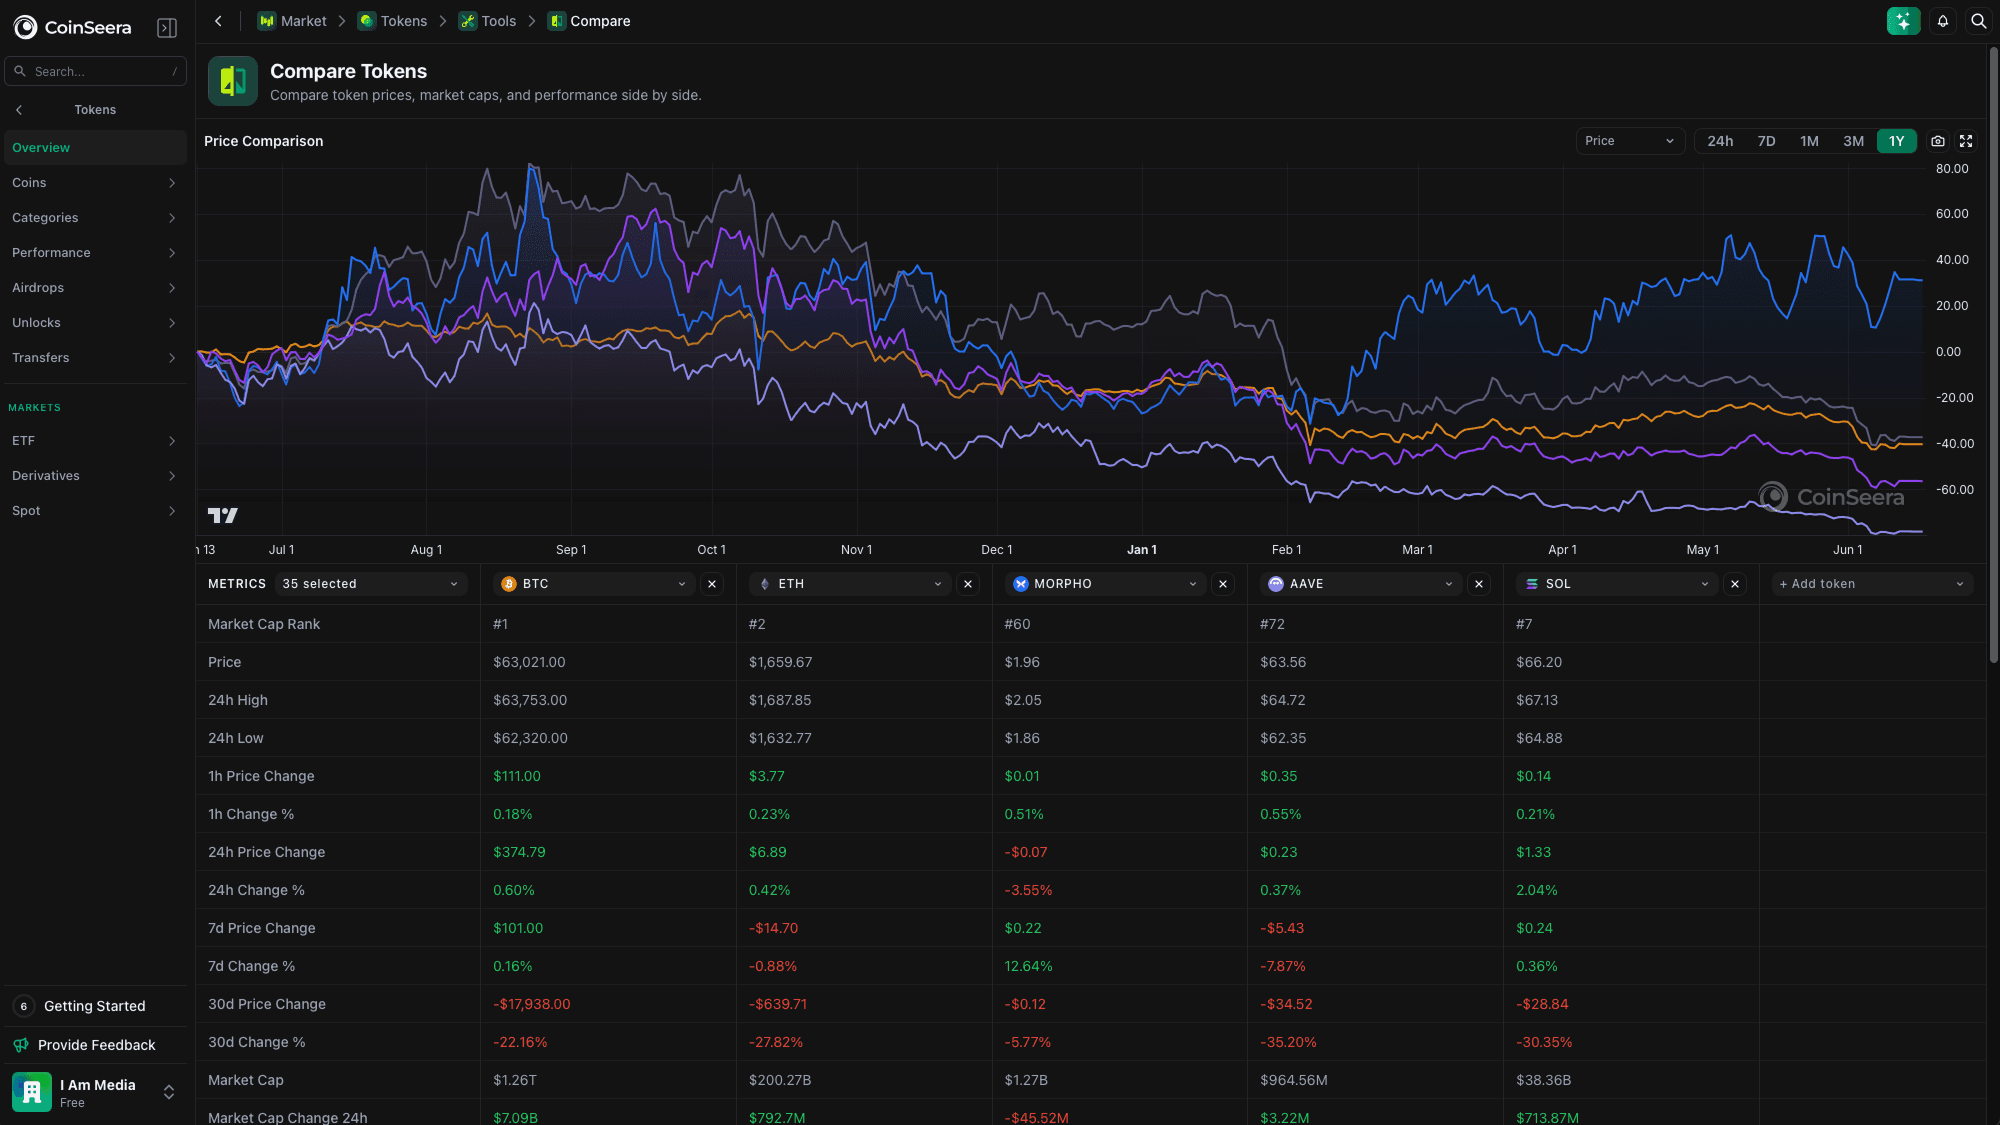
Return, with the arithmetic left in
- Every window, one row
- Day to inception
- Split, never merged
- Realised and unrealised
- Which line carried the number
- Contribution
Every window on the whole book and on each line, realised split from unrealised, and the contribution behind the total rather than a single figure to take on trust.
Every tool takes a position as an input.
The research tools are not a separate product. Point any of them at a position and it works the way it does everywhere else, on the same data this page is built from.







Every tool in one place. That’s the new standard.
Meet the connected suite that powers your entire portfolio.




Trusted by desks managing digital assets at scale.
See how leading desks research, track, and manage digital assets with Seerian.
“Seerian has completely transformed how our research team tracks on-chain flows. What used to take hours now takes minutes.”

“The unified dashboard across exchanges and wallets gives us a single source of truth. Our portfolio managers finally have real-time clarity.”
“Building earning strategies means constantly researching new protocols, assets, and pools. Seerian puts all of that data in one place, so our team can compare opportunities and move faster than ever.”
Frequently asked questions
Answers to the questions teams ask most when evaluating Seerian.
See Seerian with your team.
Book a 30-minute demo. We'll tailor it to the research workflows you run today.
Perp open interest is at a 90-day high while funding stays flat, so the move is being led by spot rather than leverage.