Market Research / Correlation
Find out what actually moves together
Measure how any set of assets moves against any other, over any window. Tokens against tokens, sectors against sectors, and crypto against the equity, commodity, and FX markets it is supposed to be diversifying from.
Every pair, in one grid
Build a matrix from any set of assets and read the whole book at once. Tokens, sectors, equity indices, commodities, and currencies sit on the same grid, measured the same way, so a cross-asset pair is no harder to check than a cross-token one.
- Any asset, any class
Tokens, categories, stocks, ETFs, commodities, and FX
- One consistent measure
The same returns basis across every pair on the grid
- Read it at a glance
Tinted by strength, so the clusters find themselves
Correlation is not a constant
A single coefficient hides the thing that matters. Track any pair as a rolling series to see where the relationship held, where it broke, and how long the decoupling actually lasted before it closed again.
- Rolling windows
Any lookback, from a month to multiple years
- Spot the regime change
See exactly when a pair decoupled or inverted
- Test the hedge
Check a relationship held when you needed it to
From a coefficient to a decision
A number on a grid is where the question starts. Click any pair to open it side by side on price, drawdown, and volume, so you can see the periods driving the reading rather than taking the statistic on trust.
- Open any pair
Jump from a cell straight into the comparison
- See what drove it
The windows behind the number, not just the number
- Share the finding
Save it to a workspace and annotate it for the desk
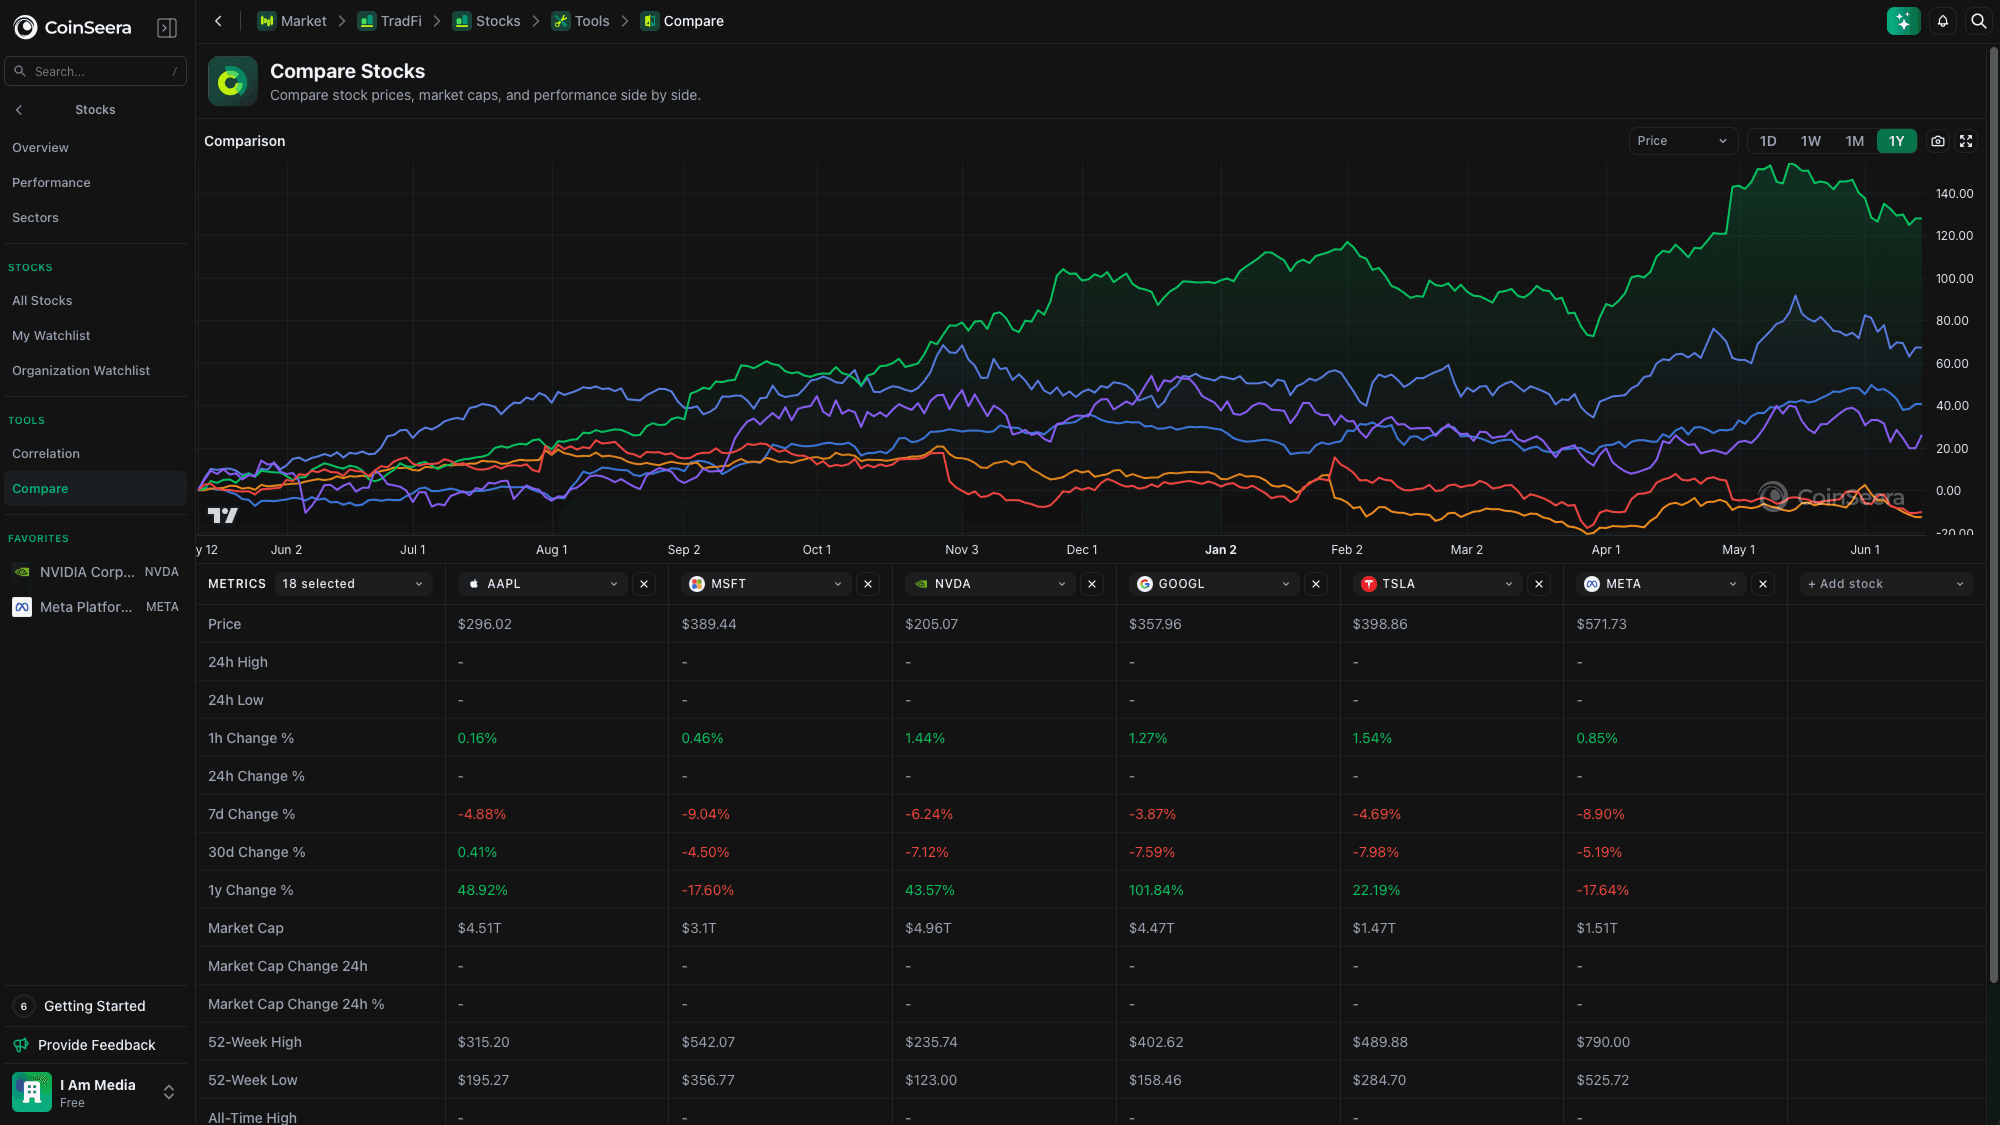
Correlation across everything you hold
- Digital assets
- 130,000+
- On one grid
- Crypto + TradFi
- From 30 days to multi-year
- Any window
The same measure over every asset class we cover, computed on a consistent returns basis so a crypto-to-equity pair is as trustworthy as a crypto-to-crypto one.
Team collaboration in context
Document research findings, attach notes to specific chart coordinates, and discuss asset positioning with your team directly alongside real-time market data.
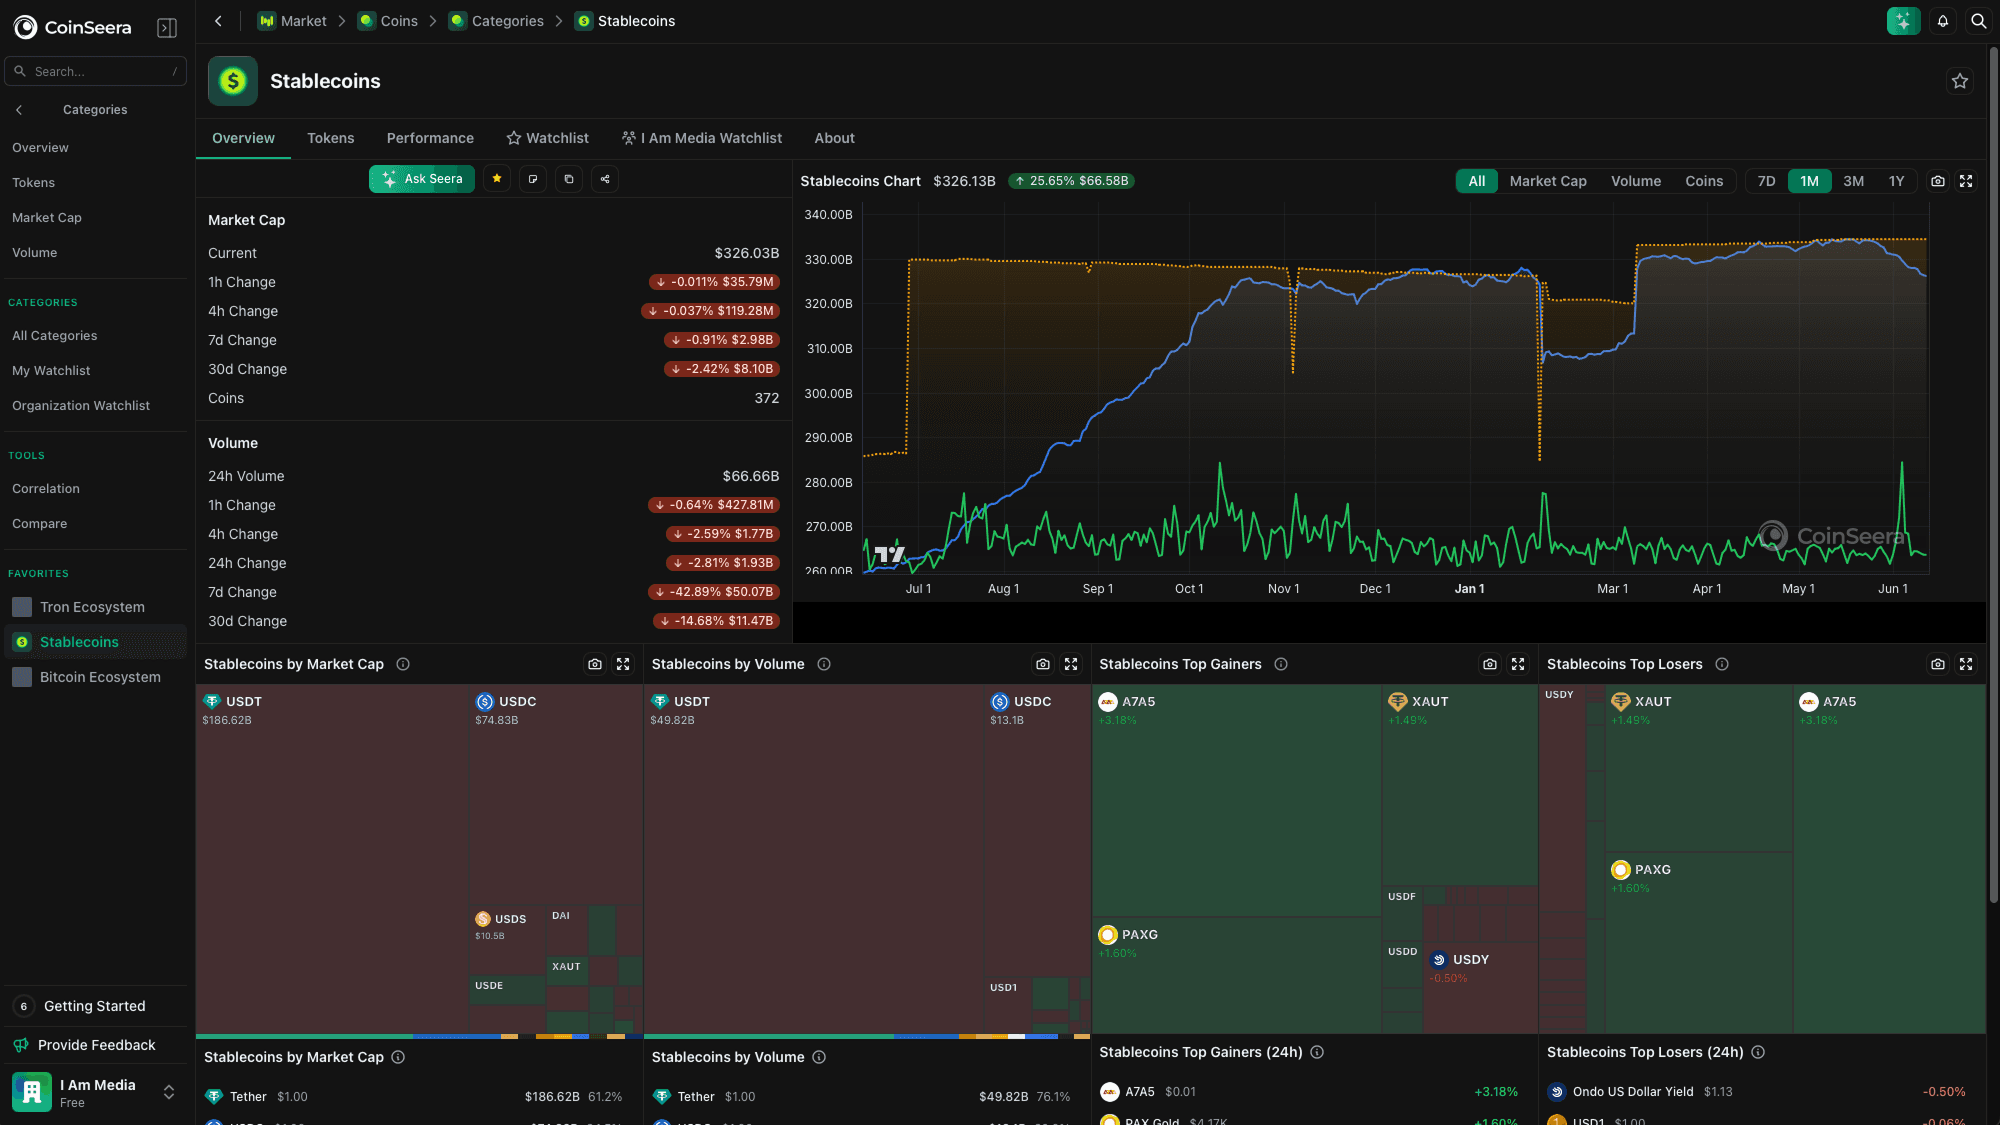
Trusted by institutional teams managing digital assets at scale
Discover how top investment firms, funds, and family offices consolidate market intelligence into one workspace.
“Before Seerian, we were paying for separate analytics platforms and manually stitching the data together in internal dashboards. Now, our entire research stack is in one place, natively integrated, and perfectly mapped to our live portfolio. It completely changed how we evaluate our positions.”

Managing PartnerCrypto Fund
“Seeing derivative flows, funding rates, and liquidity levels directly alongside our active wallet positions changed how we manage downside risk. We don’t just look at isolated market data anymore; we see exactly how it impacts our specific holdings in real time.”
Portfolio ManagerProprietary Trading Firm
“The ability to have our entire analyst team working out of the same shared watchlists and project folders has eliminated the scattered research we used to share over chat. Everyone is finally looking at the same data, at the same time.”
Head of ResearchInstitutional Investment Firm
“Before Seerian, we were paying for separate analytics platforms and manually stitching the data together in internal dashboards. Now, our entire research stack is in one place, natively integrated, and perfectly mapped to our live portfolio. It completely changed how we evaluate our positions.”
Managing PartnerCrypto Fund
“Seeing derivative flows, funding rates, and liquidity levels directly alongside our active wallet positions changed how we manage downside risk. We don’t just look at isolated market data anymore; we see exactly how it impacts our specific holdings in real time.”
Portfolio ManagerProprietary Trading Firm
“The ability to have our entire analyst team working out of the same shared watchlists and project folders has eliminated the scattered research we used to share over chat. Everyone is finally looking at the same data, at the same time.”
Head of ResearchInstitutional Investment Firm
Frequently asked questions
Answers to common questions institutional teams ask when evaluating Seerian.
Experience Seerian with your team
Schedule a 30-minute demonstration tailored to your organization's research and portfolio requirements.