Market Research / Charts
77 charts, ready to go
A curated library across global markets, DeFi, derivatives, spot, indicators, heatmaps, ETFs, and your own portfolio. Favourite the ones your desk lives on and pin them to a dashboard.
A library, not a chart builder
Nobody wants to construct a funding-rate chart from primitives. Every series a desk actually checks is already built, already sourced, and already labelled, organised into eight categories so finding one takes a search rather than a project.
- 77 charts
Across 8 categories, built and maintained
- Every mark type
Series, bars, heatmaps, and distributions
- Sourced and defined
What each series measures, stated on it
Favourite the ones you use
Star a chart and it follows you. Star it for the organization and it follows the whole desk, so the series your team argues from is the same series everyone opens.
- Personal favourites
Your own shortlist, on every device
- Organization favourites
One shortlist the whole desk shares
- Onto a dashboard
Drag any chart onto a shared board

Including your own book
The portfolio category charts your positions on the same surface as the market, so a question about your exposure and a question about the market are answered with the same tool.
- Portfolio charts
Your positions, on the market’s own surface
- Any window
Intraday through multi-year history
- Export or share
Take the series with you, or annotate it in place
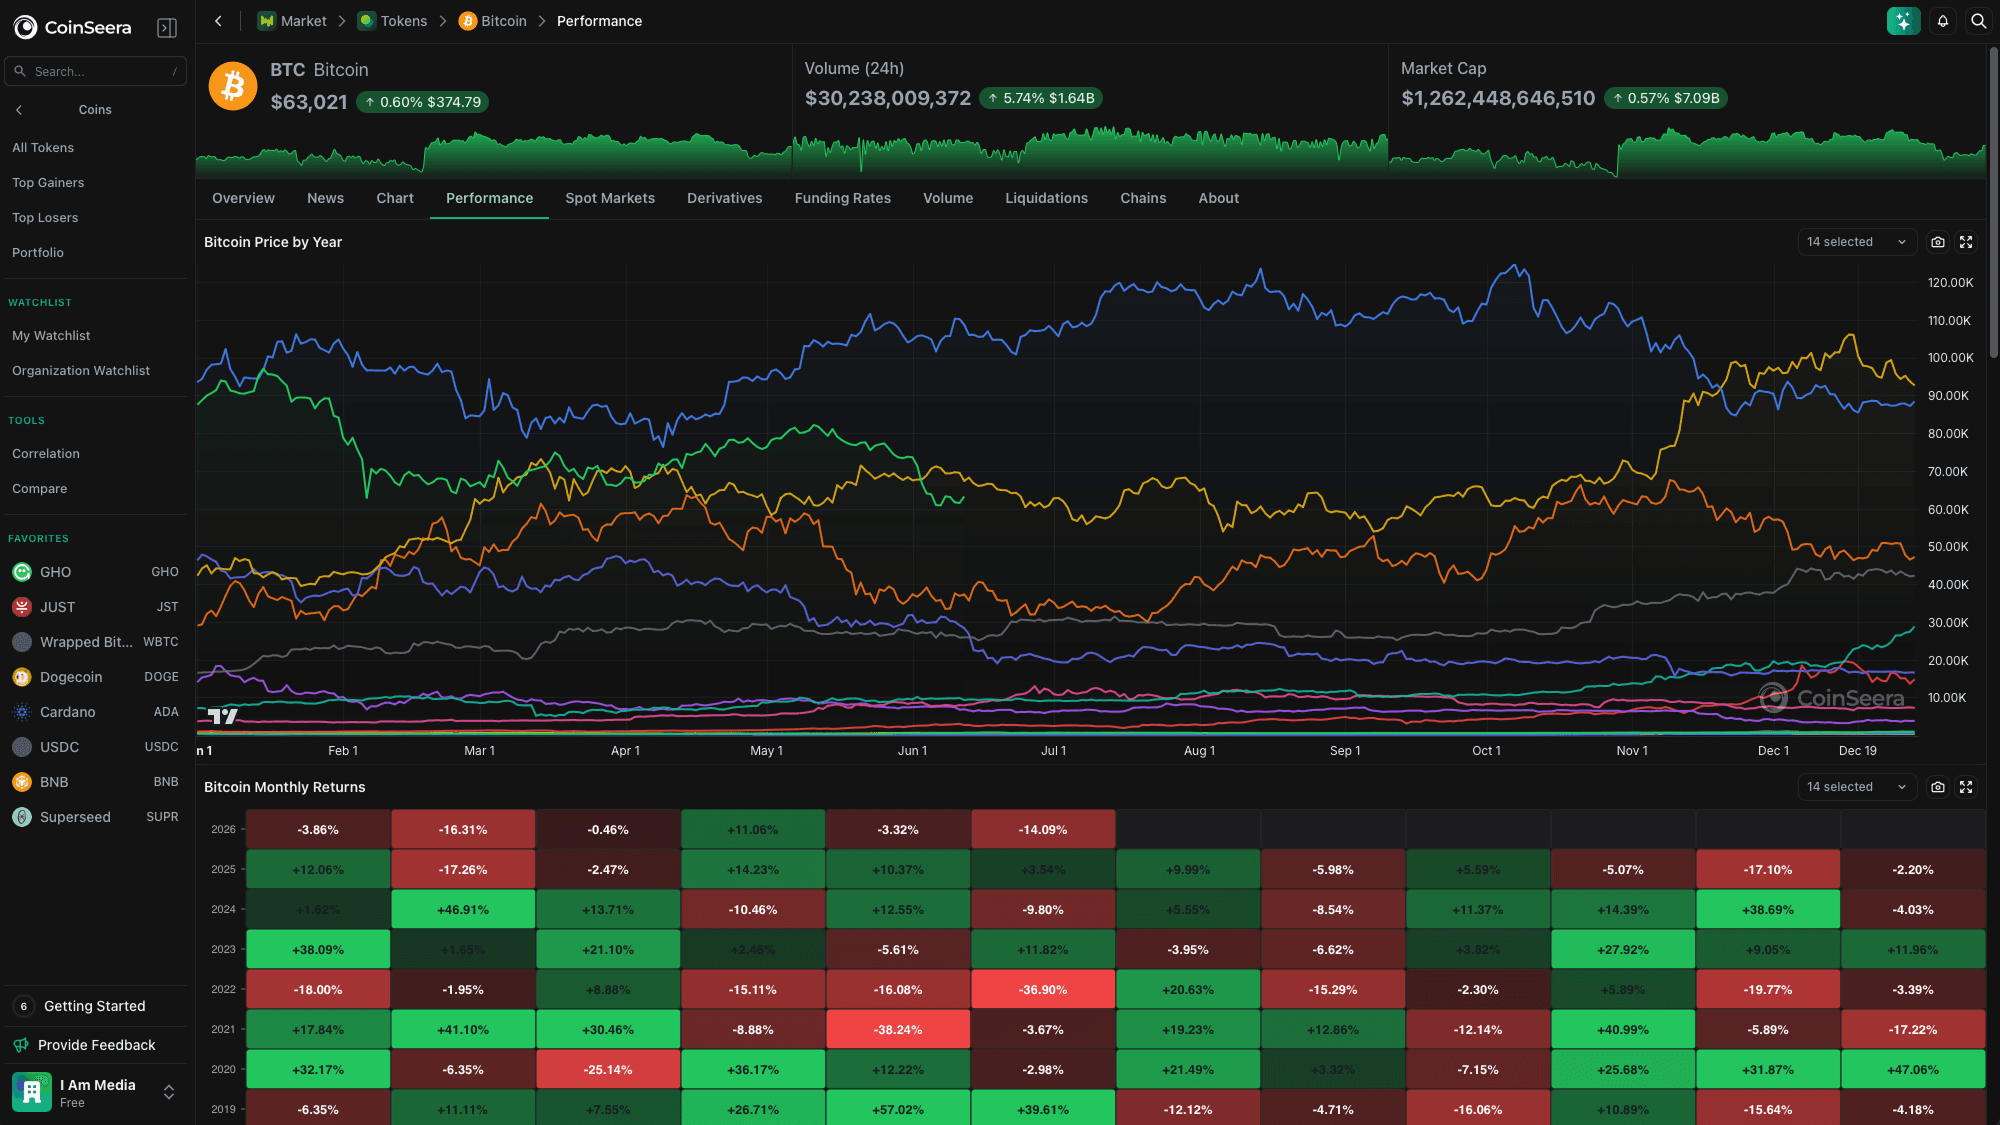
A chart for every question a desk asks
- Charts in the library
- 77
- Categories, from global to portfolio
- 8
- Personal and organization
- Favourites
Built, sourced, and maintained series across every category we cover, favourited personally or organization-wide and droppable onto any dashboard.
Team collaboration in context
Document research findings, attach notes to specific chart coordinates, and discuss asset positioning with your team directly alongside real-time market data.
Trusted by institutional teams managing digital assets at scale
Discover how top investment firms, funds, and family offices consolidate market intelligence into one workspace.
“Before Seerian, we were paying for separate analytics platforms and manually stitching the data together in internal dashboards. Now, our entire research stack is in one place, natively integrated, and perfectly mapped to our live portfolio. It completely changed how we evaluate our positions.”

Managing PartnerCrypto Fund
“Seeing derivative flows, funding rates, and liquidity levels directly alongside our active wallet positions changed how we manage downside risk. We don’t just look at isolated market data anymore; we see exactly how it impacts our specific holdings in real time.”
Portfolio ManagerProprietary Trading Firm
“The ability to have our entire analyst team working out of the same shared watchlists and project folders has eliminated the scattered research we used to share over chat. Everyone is finally looking at the same data, at the same time.”
Head of ResearchInstitutional Investment Firm
“Before Seerian, we were paying for separate analytics platforms and manually stitching the data together in internal dashboards. Now, our entire research stack is in one place, natively integrated, and perfectly mapped to our live portfolio. It completely changed how we evaluate our positions.”
Managing PartnerCrypto Fund
“Seeing derivative flows, funding rates, and liquidity levels directly alongside our active wallet positions changed how we manage downside risk. We don’t just look at isolated market data anymore; we see exactly how it impacts our specific holdings in real time.”
Portfolio ManagerProprietary Trading Firm
“The ability to have our entire analyst team working out of the same shared watchlists and project folders has eliminated the scattered research we used to share over chat. Everyone is finally looking at the same data, at the same time.”
Head of ResearchInstitutional Investment Firm
Frequently asked questions
Answers to common questions institutional teams ask when evaluating Seerian.
Experience Seerian with your team
Schedule a 30-minute demonstration tailored to your organization's research and portfolio requirements.